 BTC
BTC ETH
ETH BNB
BNB XRP
XRP SOL
SOL TRX
TRX STETH
STETH ZEC
ZEC HYPE
HYPE DOGE
DOGE WBTC
WBTC XMR
XMR LINK
LINK ADA
ADA LEO
LEO XLM
XLM RAIN
RAIN NEAR
NEAR BCH
BCH WBETH
WBETH USDTTether
 USDCUSDC
 USTalus
 JCTJanction
 RLCiExec RLC
 KAIAKlaytn
 DRVDerive
 Binance
 Pionex
 LBank
LBank WEEX
WEEX XT.COM
Metrics explained
What every figure on this site means, where it comes from and what it does not say, shown on the site's own screens. The exact formulas are on the methodology page; this page is the plain-language guide.
By market cap
 Cointelegraph
 CoinDesk
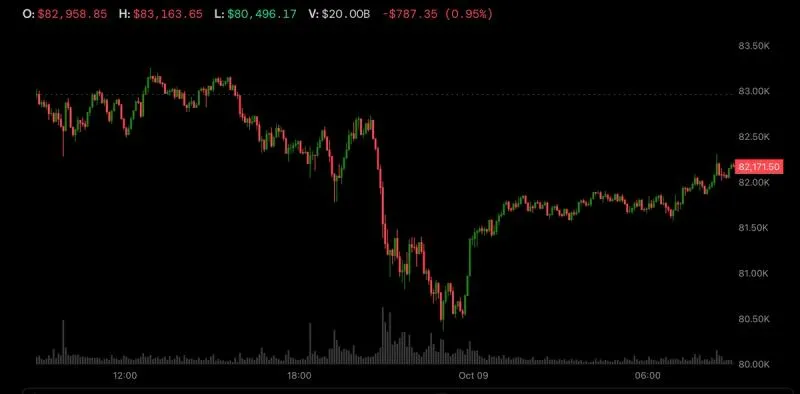
The idea in four sentences
A crypto price is not one number that exists somewhere: it is made from hundreds of markets on dozens of exchanges, and every tracker decides which of them to believe. Most show the result and keep the decision to themselves. Coinsprey shows the decision: which markets made the price, which were left out and why, and how much the result can be trusted.
The same goes for volume. An exchange reports its own volume and nobody audits it, so the reported figure is always shown as reported, and beside it stands what public data can confirm: the orders actually resting in the order book and the trades actually printed on the public tape.
Every rule is published, applied by a program in the same way to every exchange and every coin, and nobody edits a result by hand. No exchange and no project can pay for a better figure. Where something cannot be measured, the page says “not measured” and concludes nothing.
Price and price confidence
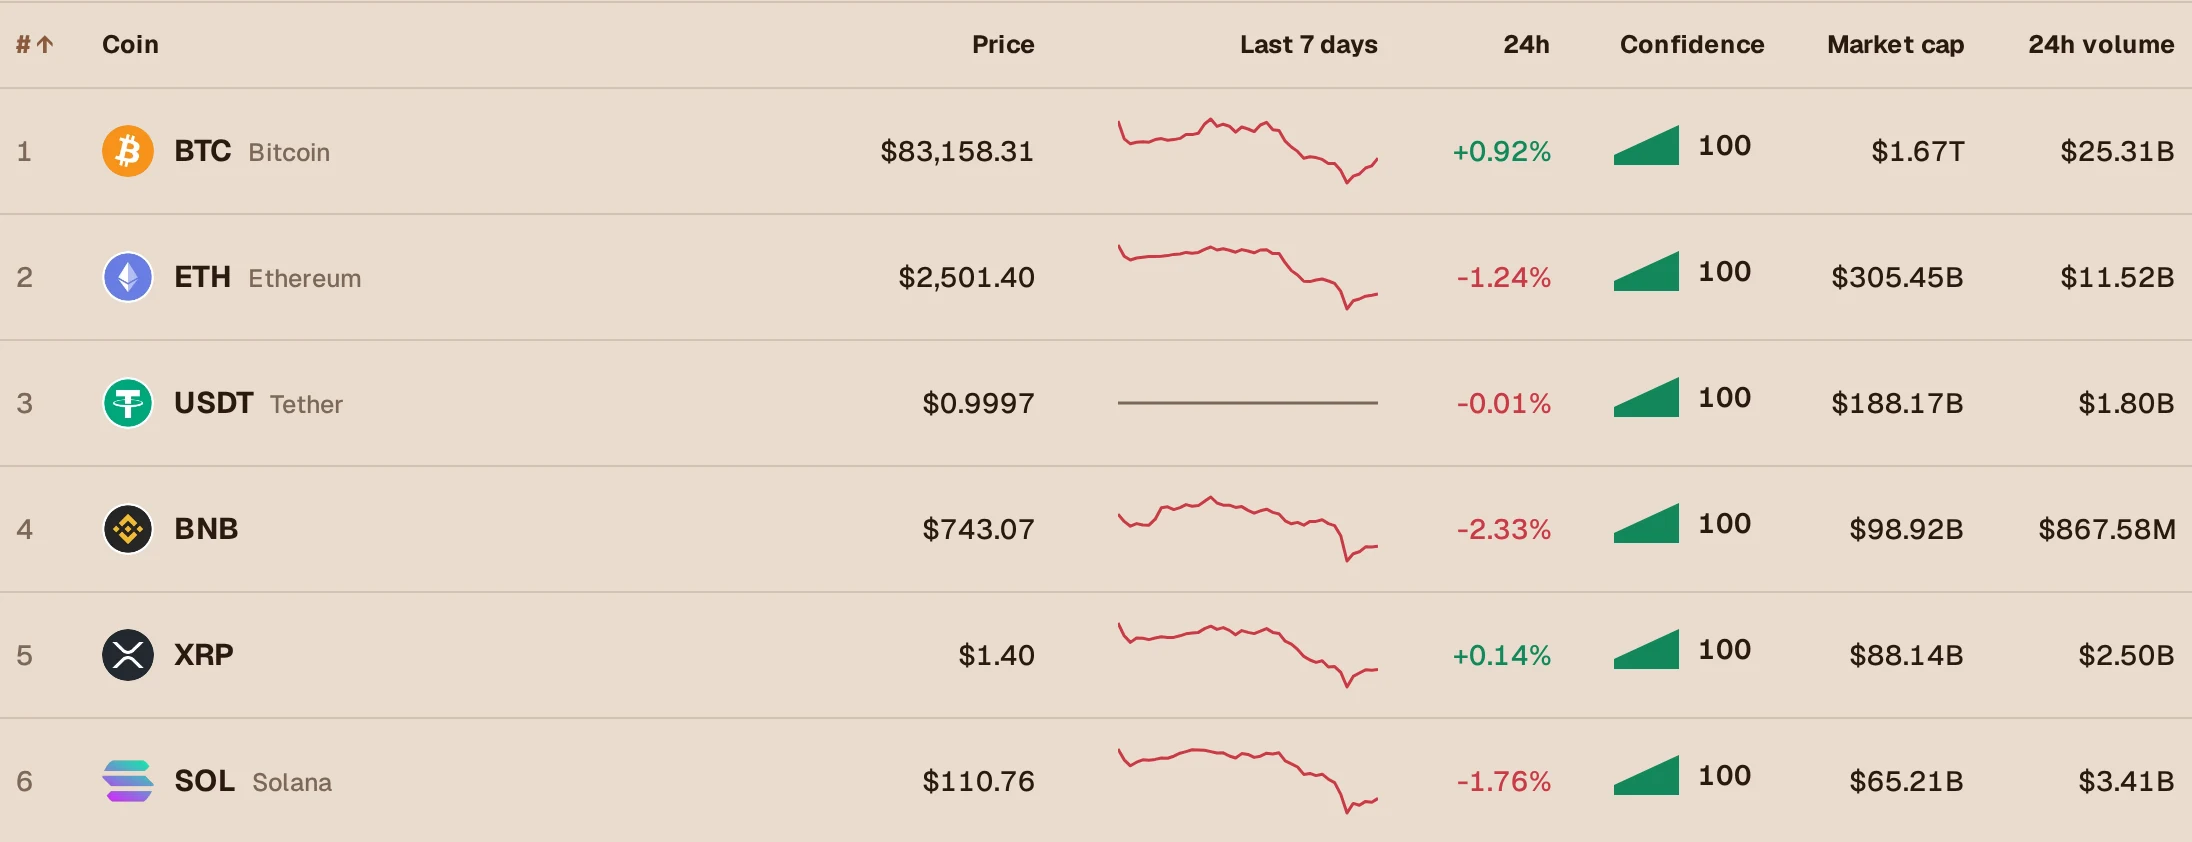
Coinsprey price
What it is
One dollar price per coin: the volume-weighted average of the markets that count.
How it is obtained
Each market is converted to US dollars. Markets more than 10% from the volume-weighted median are left out; when the markets left out agree among themselves on many more exchanges than hold the median, they are the price instead.
What it does not say
It is not the price on any single exchange and not a price at which an order of any size can be filled.
Price confidence
What it is
A score from 0 to 100 for how well the price is supported, always shown with its parts.
How it is obtained
The weighted mean of seven measured parts, listed below. A part that cannot be measured is left out and the weights of the others are scaled up.
What it does not say
It says nothing about the coin as a project or as an investment. A coin can be worthless with a perfectly well-established price.
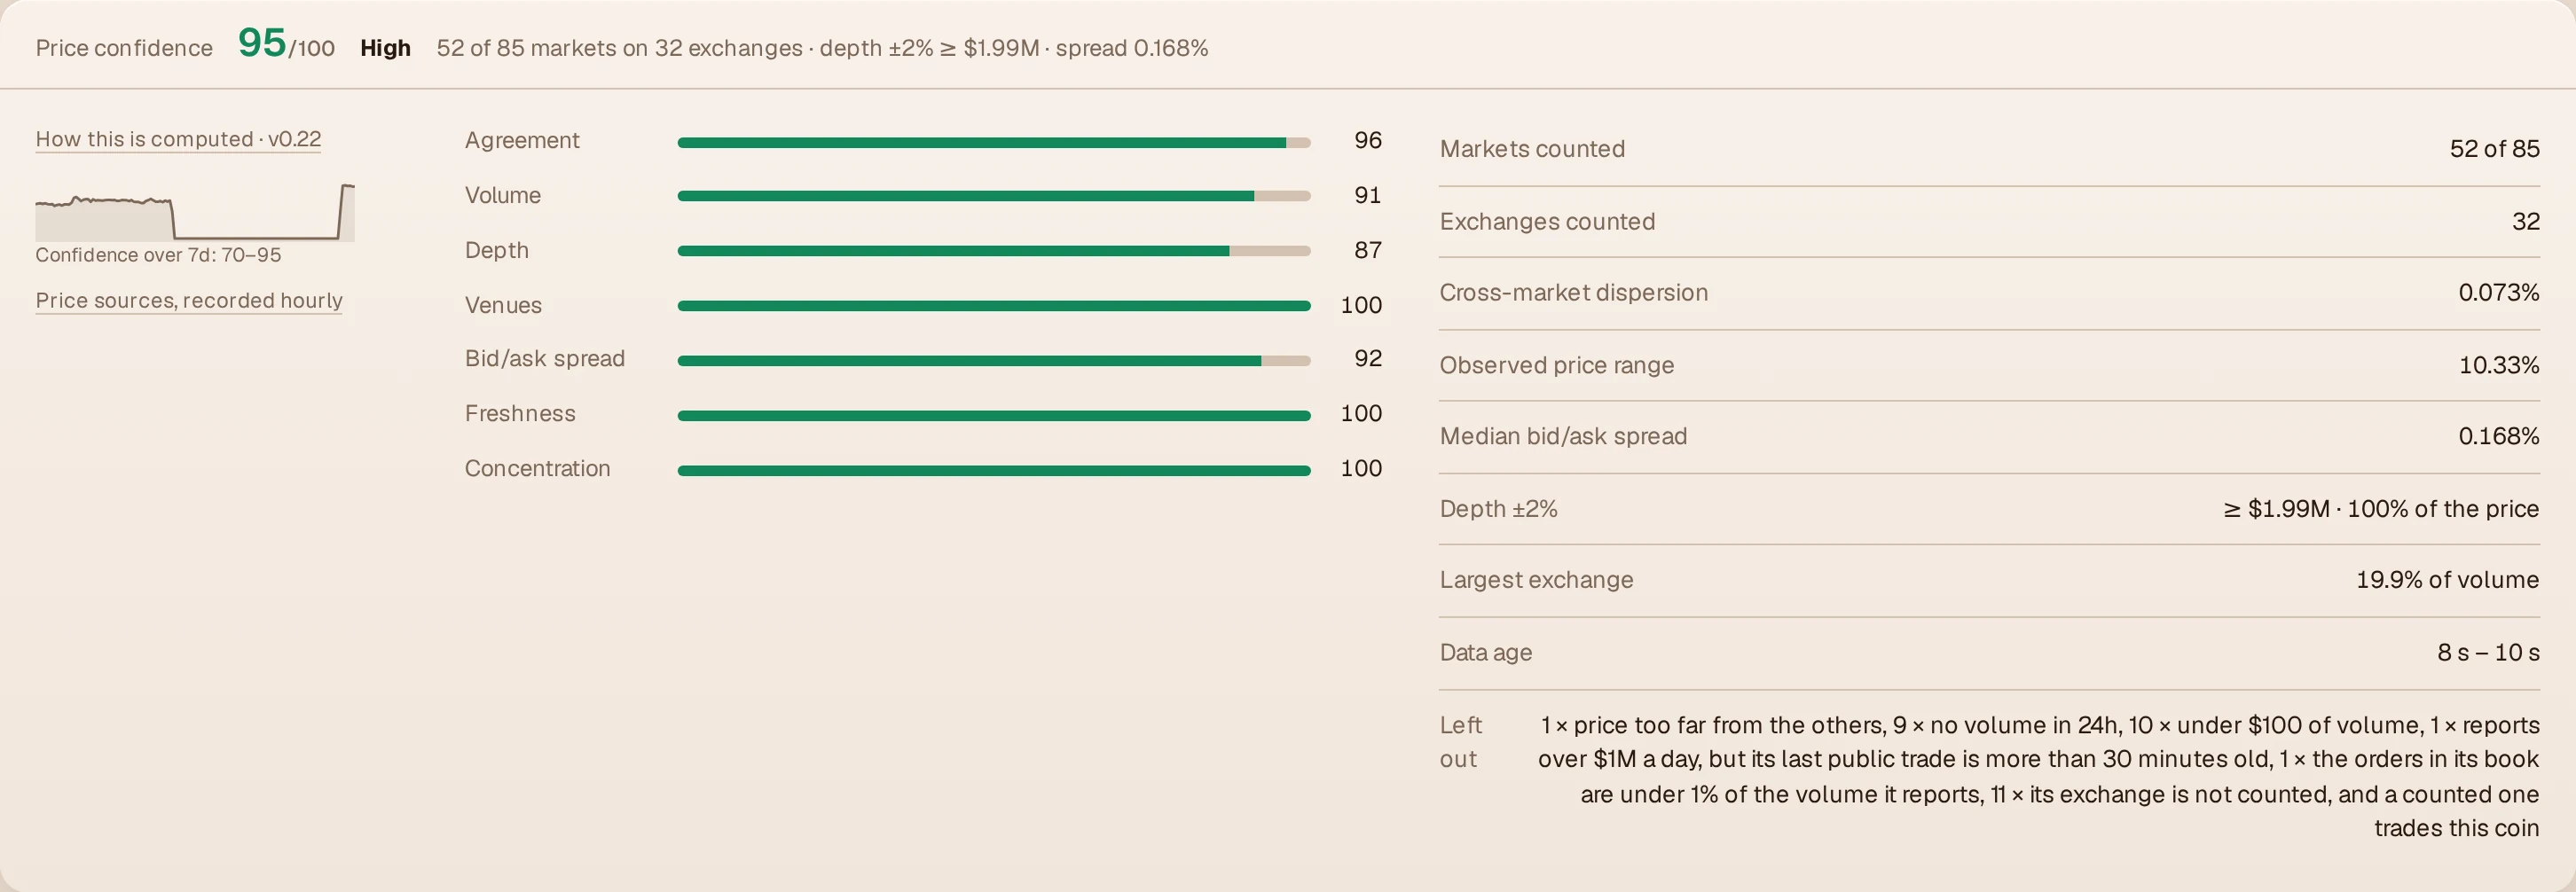
| Part | Weight | What it looks at |
|---|---|---|
| Agreement | 25 | How closely the counted markets agree on the price. |
| Venues | 20 | How many exchanges the price rests on. |
| Volume | 15 | How much trades on the counted markets in 24 hours. |
| Depth | 15 | The value of the orders resting within 2% of the price in the order books that were read. |
| Bid/ask spread | 10 | The typical distance between the best buy and the best sell order. |
| Concentration | 10 | Whether one exchange carries most of the volume. |
| Freshness | 5 | How old the newest and the oldest reading behind the price are. |
A price that rests only on exchanges that are not counted cannot score above 40, and such a coin is left out of the market's total volume and market cap.
Which markets make the price
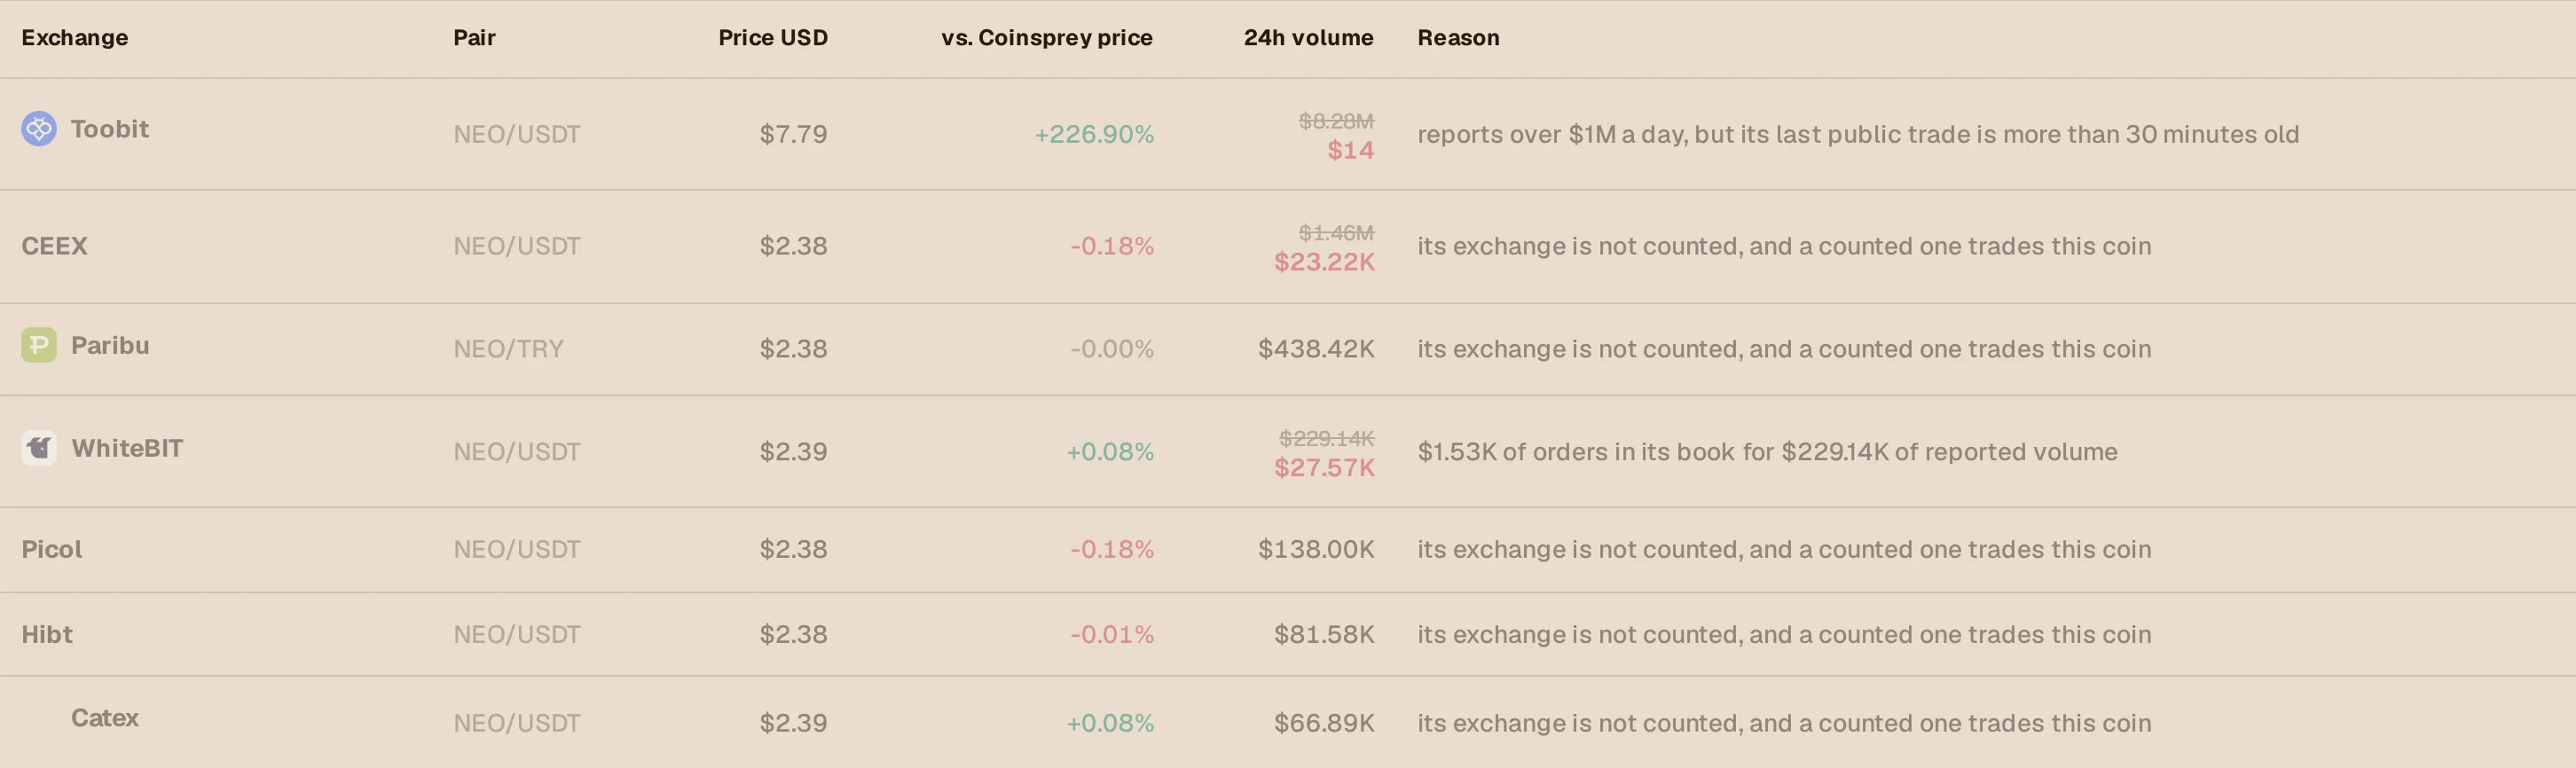
Every market of a coin is listed on the coin's page, counted or not. A market that is not counted is still shown with its price and volume; it only does not enter the average. These are the reasons a market can carry:
| Reason shown | What it means |
|---|---|
| stale data | The exchange's last reading is older than three minutes. |
| quote not convertible to USD | The market is priced in an asset that has no dollar price here. |
| no volume in 24h | Nothing traded there in the last day, so its price is from some earlier time. |
| under $100 of volume | A few dollars traded at any price, while the coin has real markets. |
| price too far from the others | More than 10% from the volume-weighted median of the coin's markets. |
| its exchange is not counted | The exchange does not pass the checks below, and an exchange that does trades the coin. |
| orders in its book under 1% of its volume | The market reports far more volume than its order book could carry, and the coin has markets that are backed. |
| no recent public trade | The market reports over $1M a day while its newest public trade is more than 30 minutes old. |
The last three apply only when the coin has other markets that are sound. A coin whose only market is one of these keeps that price, with low confidence, because a doubtful price is more useful than none as long as it is labelled.
Supply, market cap and the labels beside them
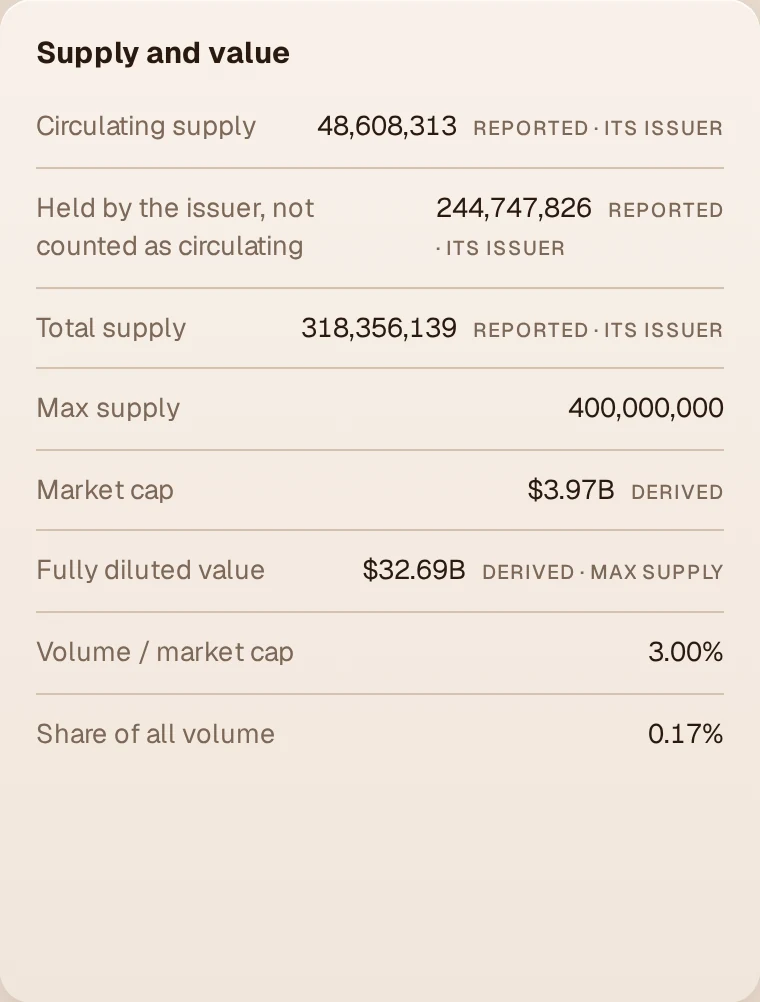
Market cap is price times circulating supply, so it is only as good as the supply figure. Every supply figure therefore says how it is known:
| Label | Meaning |
|---|---|
| Measured | Read by Coinsprey from the source itself: a token contract on its blockchain, a chain's own supply figure, an order book. |
| Reported | Published by somebody else (an exchange, the coin's issuer, a reference list) and not verified. The source is named beside the figure. |
| Entered | Typed in by hand from public figures for a handful of coins; approximate. |
| Derived | Computed from the figures above, for example market cap from price and circulating supply. |
| Estimated | A stand-in where the real figure is not known, marked with ~. A market cap computed from the total supply is one. |
Coins are ranked by market cap in two groups: first those with a known circulating supply, then those with only an estimate. The market's total market cap sums known supplies only. Wrapped and staked copies of a coin (wrapped Bitcoin, staked Ether) keep their price and rank but are left out of the total, because the coin behind them is already in it. Tokenized stocks and funds have a list of their own and are not part of the crypto totals.
The exchange list, column by column
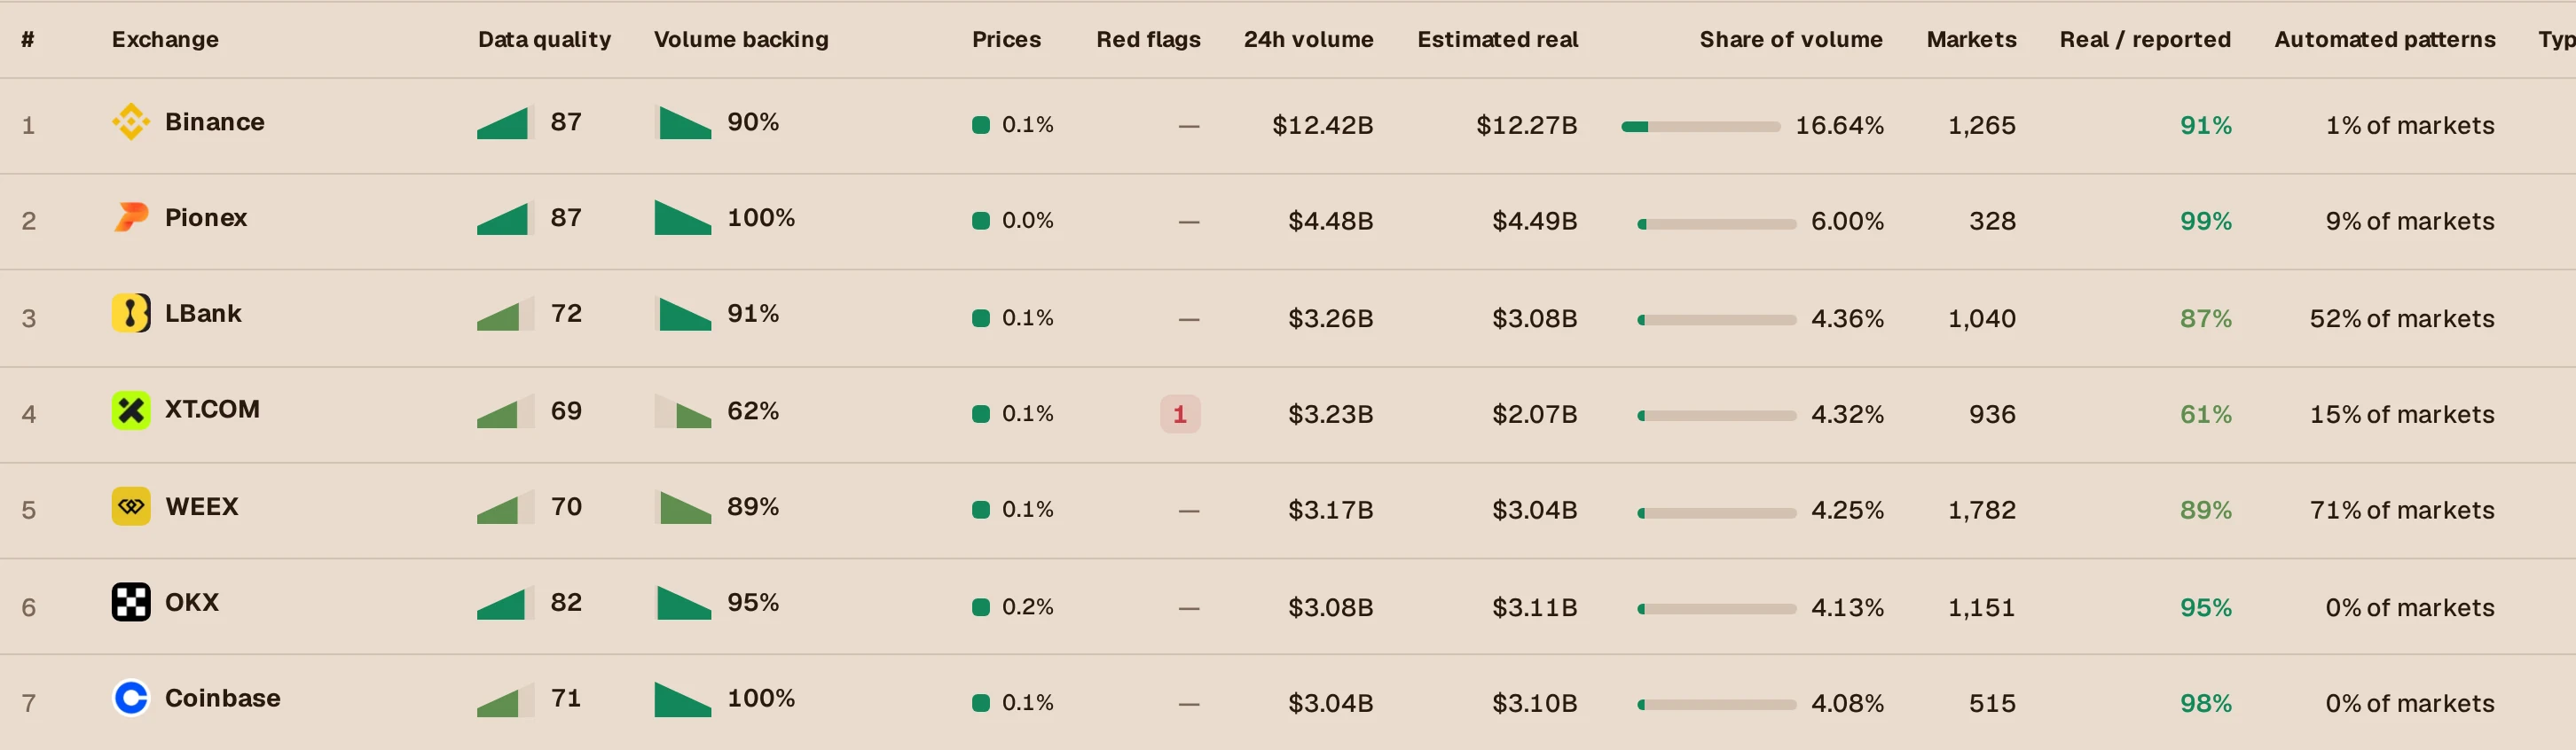
24h volume
What it is
The volume the exchange itself reports for its spot markets over 24 hours, converted to dollars.
How it is obtained
Read from the exchange's public market data once a minute. Nothing is added to it or taken away.
What it does not say
It is the exchange's own word. Nobody outside the exchange can verify it, and Coinsprey does not claim to.
Estimated real
What it is
How much of the reported volume survives the checks that public data allows, over the markets that could be measured.
How it is obtained
A market's reported volume is cut only where a measurement contradicts it: its order book could not carry it, a day of its public trades adds up to under a fifth of it, it has no recent trade, or its trades print inside the spread.
What it does not say
It is an estimate, not an audit. Where nothing contradicts the reported figure, the estimate equals it, which is not proof that the figure is true.
Volume backing
What it is
The share of an exchange's measured volume that trades on markets whose order books back it: Backed (90% or more), Mostly backed (50%), Partly backed (10%), Unbacked, or Not measured.
How it is obtained
A market is backed when the orders resting within 2% of its best bid and best ask are worth at least 1% of the volume it reports for 24 hours. Only markets trading $10,000 a day or more are judged.
What it does not say
A description, not a verdict. Fast market makers can turn a small book over many times, and an exchange that publishes no order books is 'not measured', not 'unbacked'.
Data quality
What it is
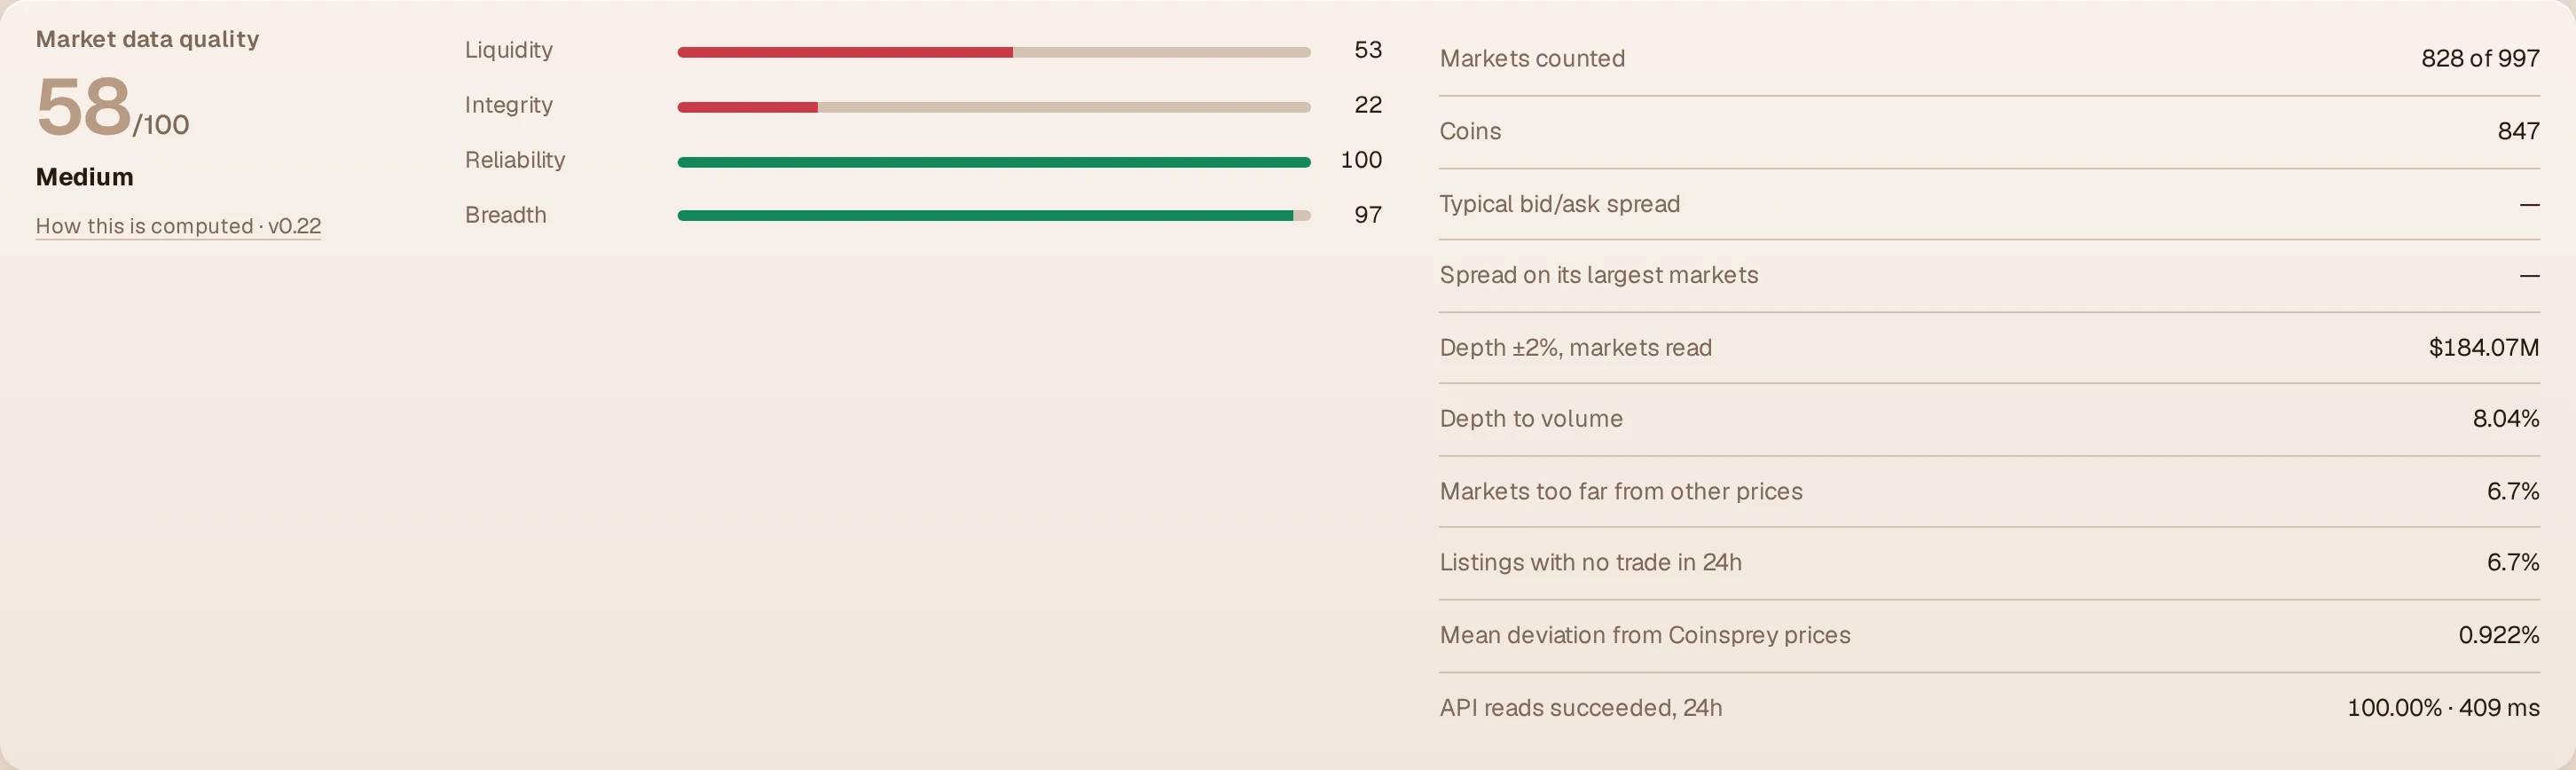
A score from 0 to 100 for the exchange's market data: liquidity (40), integrity (30), reliability (20) and breadth (10).
How it is obtained
From its own public data only: spreads, depth against volume, how many markets sit far from other exchanges' prices, how many listings never trade, and how reliably its API answers.
What it does not say
It is not a rating of safety, custody, solvency or licences. No such data is measured here, so none is scored.
Prices
What it is
How far the exchange's prices are from Coinsprey prices, as a median over coins that other exchanges also trade.
How it is obtained
Agree: within 1%. Within its spread: further, but no further than the exchange's own bid/ask spread. Off: beyond that.
What it does not say
A gap can be a real local premium, restricted deposits or withdrawals, or a thin market. Only 'off' is held against an exchange.
Real / reported and Automated patterns
What it is
The estimate as a share of the reported volume, and the share of markets whose trades show two or more machine-like patterns.
How it is obtained
Patterns are regular timing, sides alternating like coin flips and unnatural trade sizes on the public tape.
What it does not say
Patterns are not proof of anything and cut no volume: honest market-making software produces them too.
An exchange's assessment
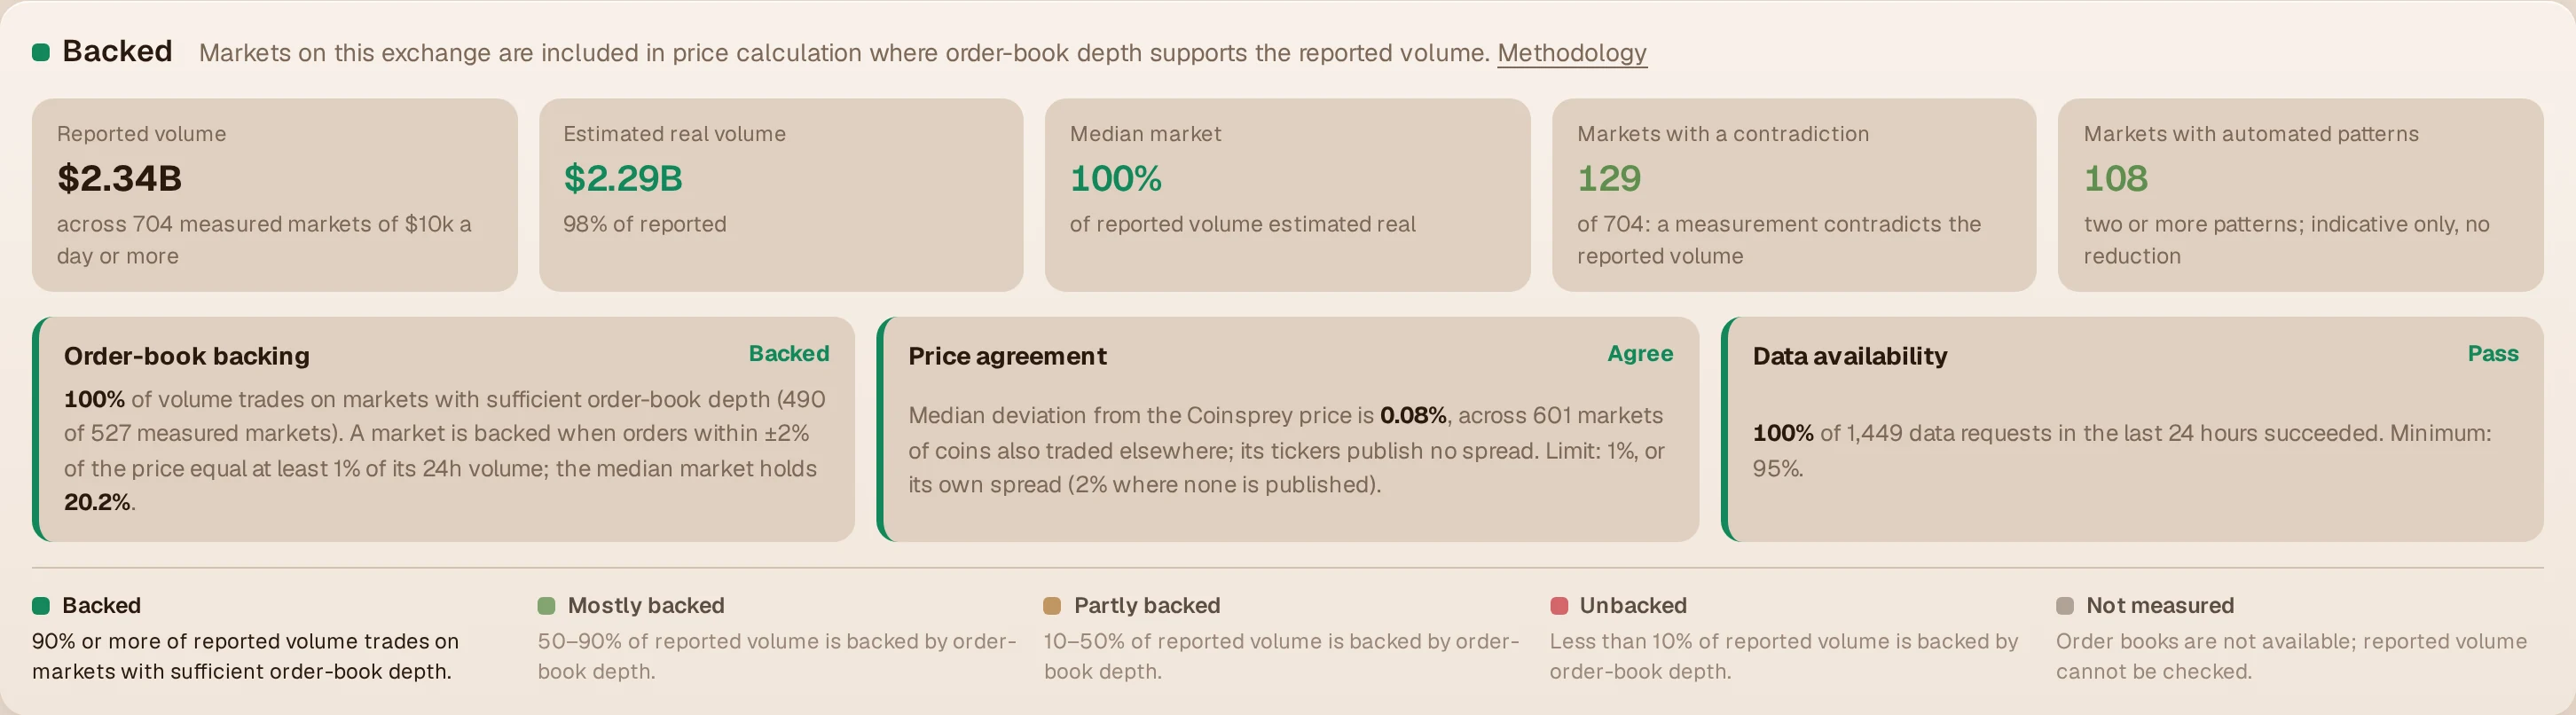
An exchange's markets are included in price calculation when three things hold: its order books can be read, its prices agree with the rest of the market, and its data arrives (at least 95% of readings succeeded over the last 24 hours). The level of volume backing is shown beside them and decides nothing by itself.
Exchanges are weighed once an hour and one changes sides only after the measurements have said so six hours in a row, so that one bad hour moves nothing. An exchange that is not counted is still listed with everything it reports; its markets set a coin's price only when no counted exchange trades that coin. A newly added exchange starts as not counted.
An exchange's markets and their marks
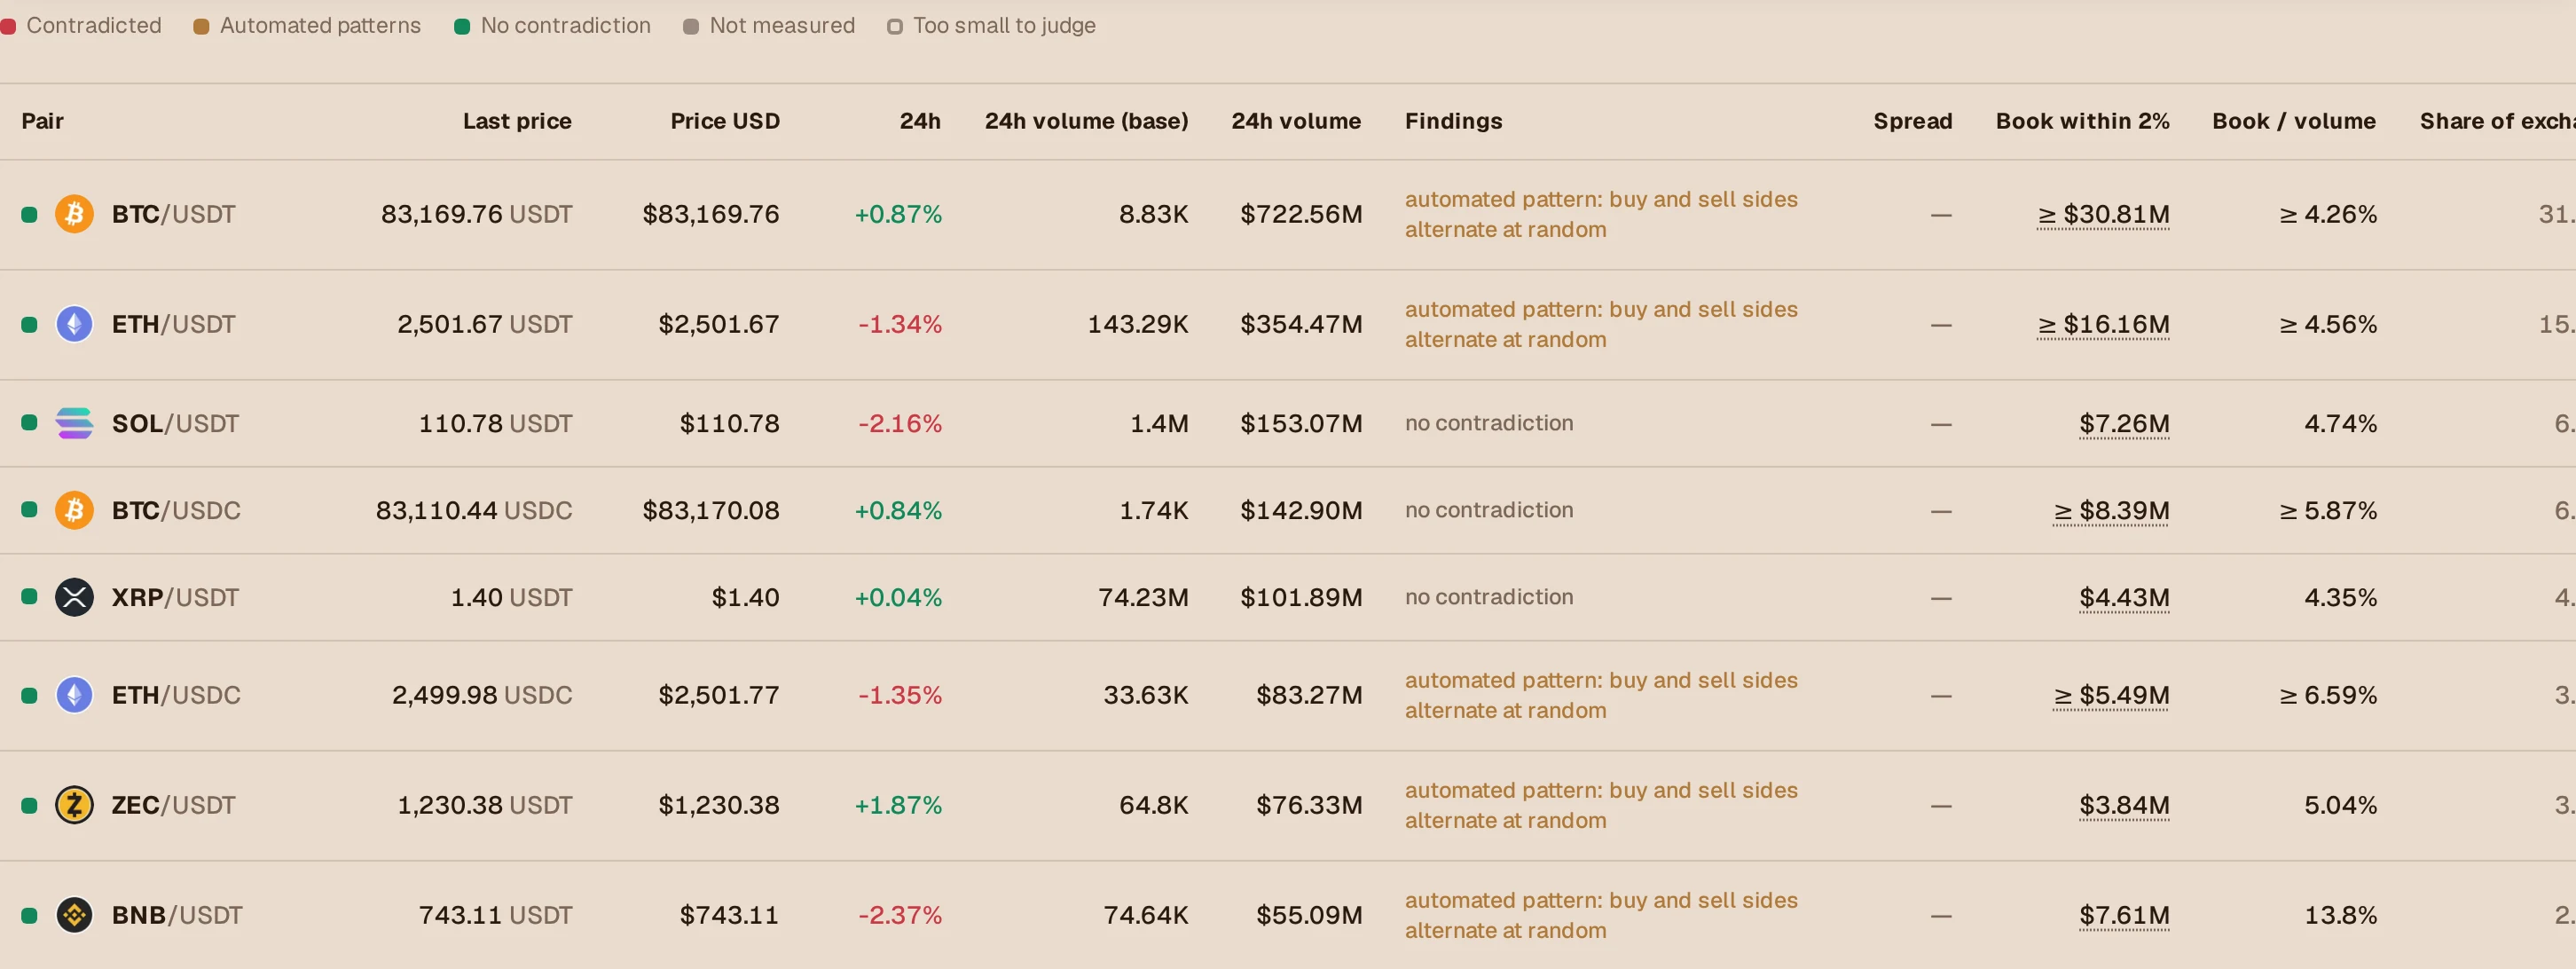
The mark and the finding
What it is
One of five marks per market: contradicted (red), automated patterns (brown), no contradiction (green), not measured (grey), too small to judge (hollow).
How it is obtained
Contradicted: one of the measurements above disagrees with the reported volume. Automated patterns: two or more machine-like patterns, and nothing contradicted.
What it does not say
Green means nothing was found against the figure, not that it was verified. A market under $10,000 a day gets figures and no conclusion.
Spread, Book within 2%, Book / volume
What it is
The distance between the best bid and ask; the dollar value of the orders within 2% of them; and that value as a share of the 24-hour volume.
How it is obtained
Read from the exchange's public order book, each side measured from its own best price. The 5% and 10% bands open on a click.
What it does not say
A book is a snapshot of one moment. Orders can be placed and pulled; a single reading is not held against a market.
Red flags and Fraud Signals

A red flag is raised by a program when a measurement has contradicted what an exchange or a coin reports for six hours in a row, and lowered the same way. It changes no price and no score. Each kind, with what else can explain it, is described on Red flags explained.
Fraud Signals are something else: documented cases entered by an editor, each with a link to its evidence and a status (alleged, confirmed, resolved). Nothing gets there automatically, and those records enter no price and no score either.
Why figures here differ from other trackers
Total volume is lower. Volume on markets that fail the checks is shown on those markets but not added to the coin's or the market's total. Other trackers either add everything an exchange reports or scale it down by a formula they do not publish.
A coin can rank differently. Rank follows market cap, and market cap follows the circulating supply. Where an issuer holds most of a token itself, those units are not counted as circulating here; where the supply is only an estimate, the coin ranks after those with a known one.
A price can differ slightly. The set of exchanges and the rule for leaving markets out are not the same anywhere. Against the largest trackers the typical difference is about a tenth of a percent on large coins.
Some coins are missing or carry another name. Two different coins often share a ticker. A market is matched to a coin by what the exchange itself calls the asset and by its price, never by the ticker alone, so a coin that only shares a ticker with a known one is listed apart.
What these figures cannot tell
Everything here is computed from public market data: prices, volumes, order books and trade feeds that exchanges publish. That data cannot show whether an exchange holds its customers' funds, whether it is licensed, or who is behind it, so none of that is rated. A high score means the published data is consistent, not that the exchange is safe.
Measurements can be wrong. An exchange can change its data format, a public feed can lag, and a rule that fits a thousand markets can misjudge one. When that happens the rule is corrected for everybody, in the open: the methodology carries a version number and says what changed in each. Nothing on this site is investment advice. Short answers to common questions are in the FAQ.